The Month and Year-to-Date in Review
So I am pretty happy with this month. The SPX (S&P 500) was fairly quiet without any huge moves and ended the month -0.04%. The RUT (Russell 2000) bucked like a freakin' bronco the entire month but ended not that much worse at -0.06% for the month. The portfolio was able to handle this RUT intra-month directional volatility fairly well since the markets ended up pretty much at the same spot they began the month and the option premiums didn't seem to rise too much as a result.
Month - March 2017
The SPY Put Write and Delta Hedge and the VIX Calendars strategies were mostly inconsequential this month both subtracting 8 bps each from the performance. As expected, the big winner in a market that doesn't move was the SPX Butterflies strategy, adding 280 bps to the portfolio's return. The RUT Iron Condors did nicely this month adding 103 bps. Finally, the RUT Butterflies didn't really do as well as I had hoped adding 20 bps to the portfolio. Being a butterfly strategy, I expected this to do better in a market that was virtually unchanged for the month but I found the RUT's yo-yo performance a little too hard to handle. Overall, the portfolio did very well with a gain for the month of +3.86%.
Year-to-Date - 1/1/2017 to 3/31/2017
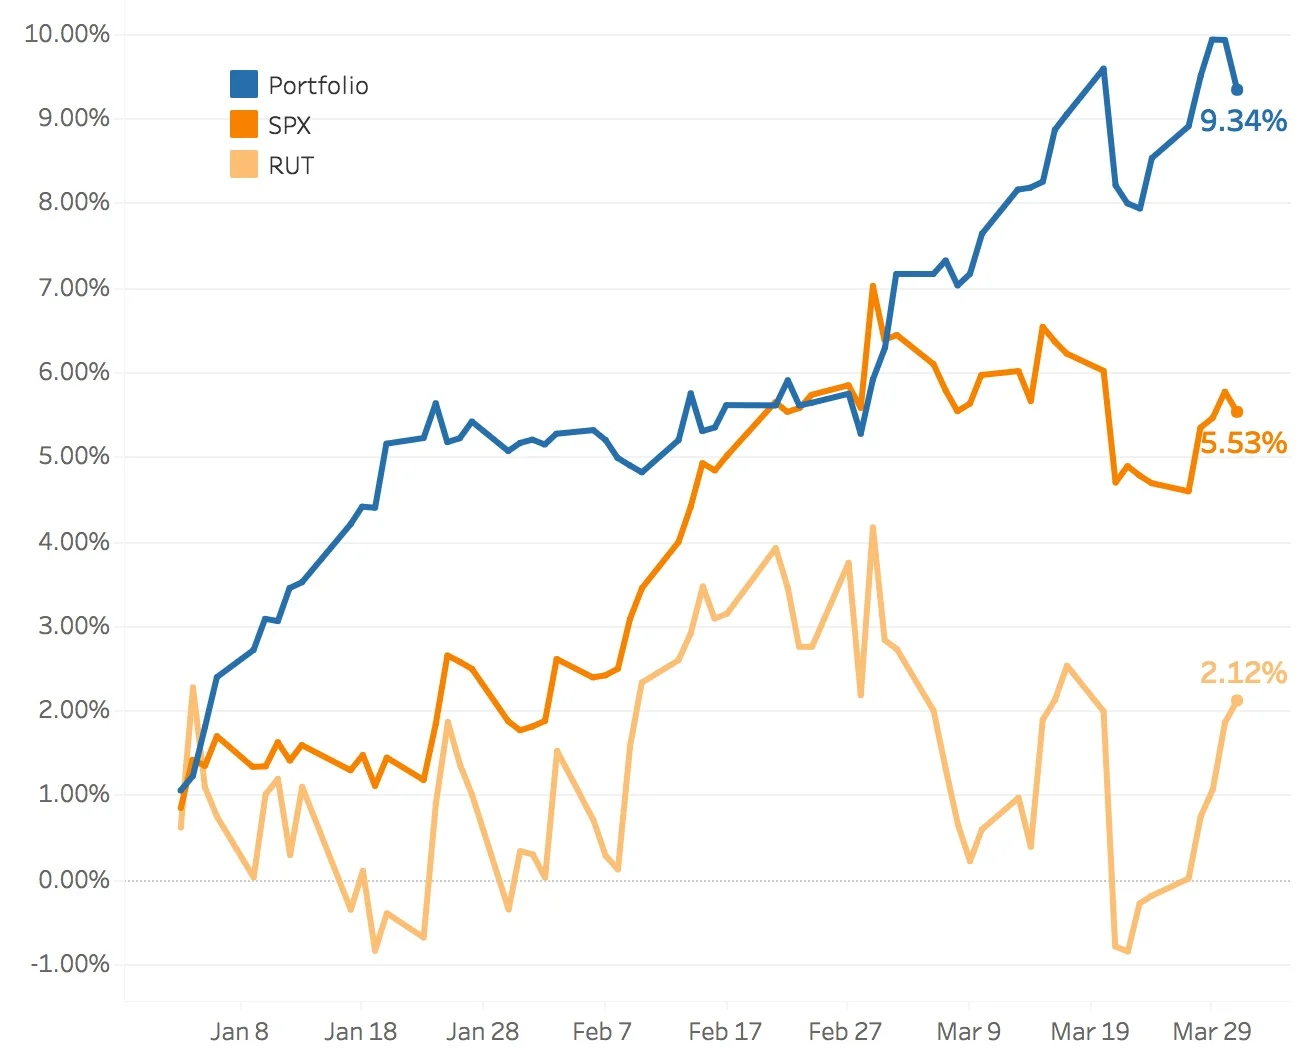
The SPY Put Write and Delta Hedge and the VIX Calendars strategies pretty much offset one another this year with the first one adding 46 bps and the second one subtracting 35 bps from the portfolio's performance during the first 3 months of the year. The best performing strategy by far was the SPX Broken Wing Butterflies strategy adding 506bps. The RUT Iron Condors strategy did reasonably well this year adding 169 bps and the RUT Butterflies strategy did nicely adding 247 bps to the portfolio. As you can see from the graph below, the delta neutral portfolio tends to do well when the markets don't move. Early January and March were periods where the SPX and RUT were relatively flat and those were the periods where I had my best performance. Late January to the end of February were a little more tumultuous and were more challenging to trade. Overall, the portfolio did very well with a gain for the year of 9.34%.
Check out the Performance page for interactive charts similar to the one below where you can slice and dice the different time periods to see which strategies did well throughout the year!